Tips:
1. Regulatory potential (RP) is a score to estimate how possible the factor can regulate a gene.
2. X axis represents the RP score. Y axis represents different factors. Dots in a y axis line means same factor.
3. Double click a region or scroll mouse to zoom in, and click “ReSet” to back.
4. Find sample information by clicking the GSM number in the tip box of each dot.
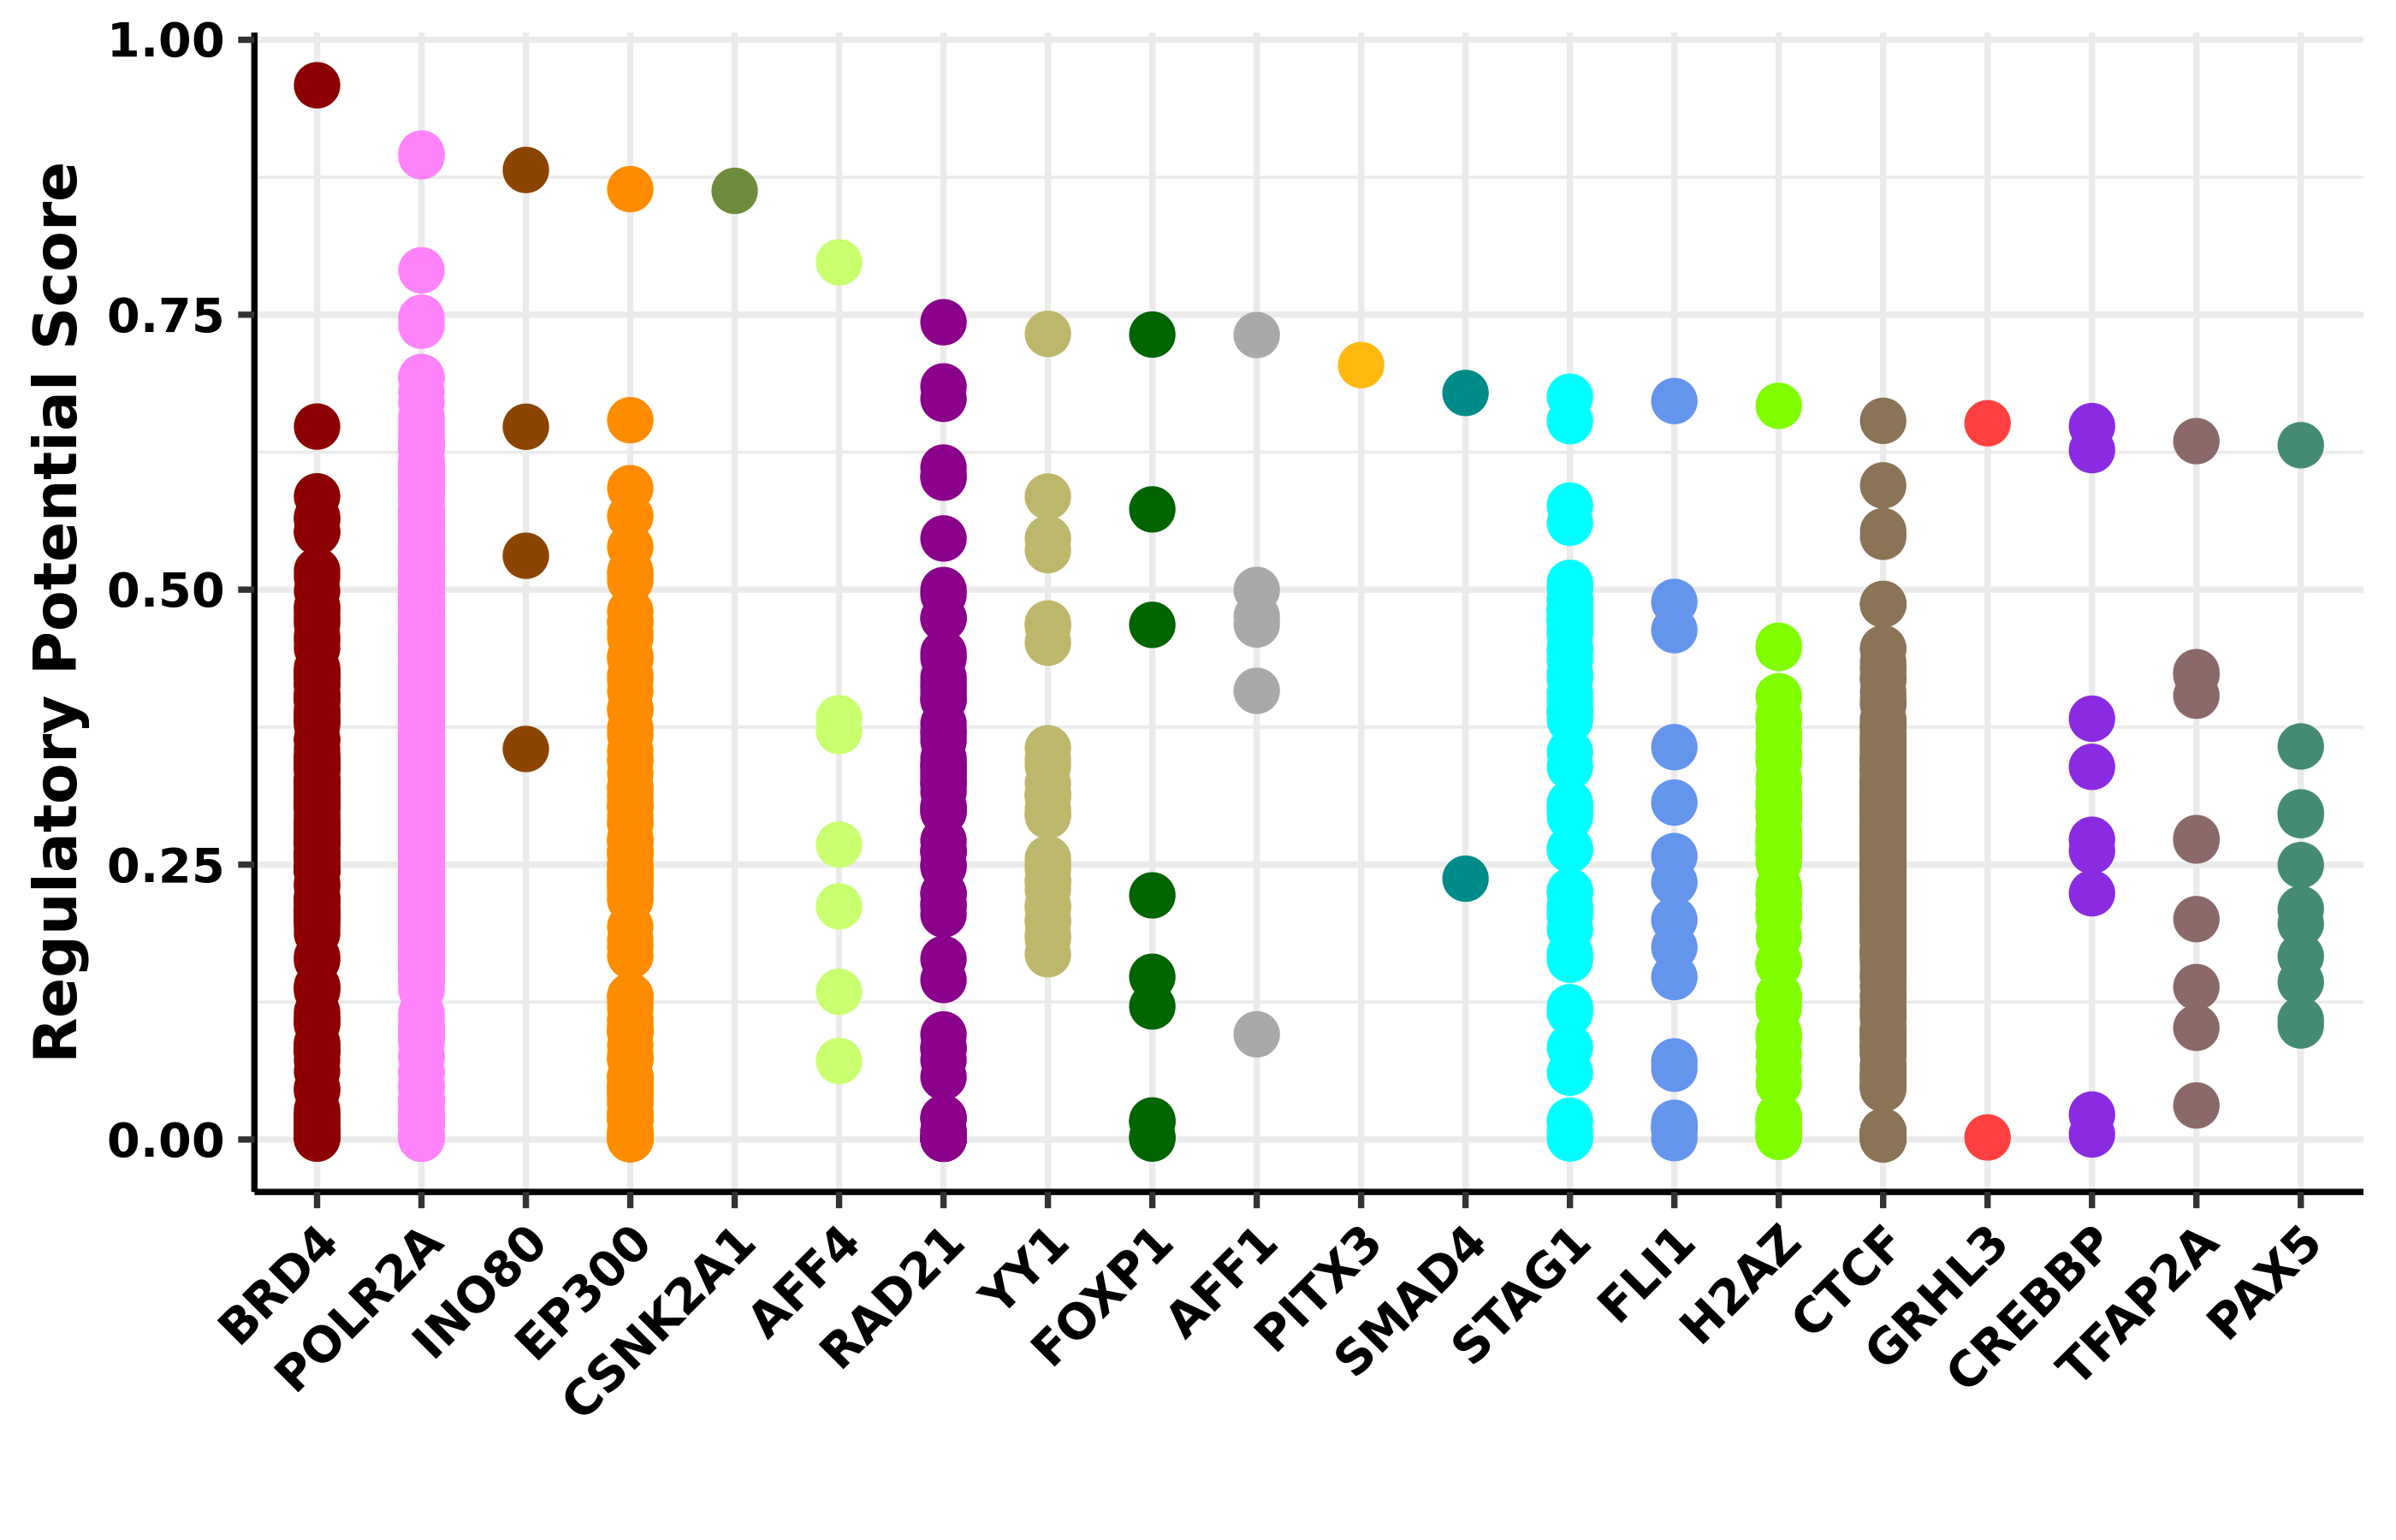
Tips:
1. Top 20 (or less) factors are showed in this plot.
2. Y axis represents the RP score. X axis represents different factors. Dots in a x axis line means same factor.
3. Plot download function is available below the figure.