Zheng R, Wan C, Mei S, Qin Q, Wu Q, Sun H, Chen CH, Brown M, Zhang X, Meyer CA, Liu XS. Cistrome Data Browser: expanded datasets and new tools for gene regulatory analysis. Nucleic Acids Res, 2018 Nov 20. Doi: 10.1093/nar/gky1094
Mei S, Qin Q, Wu Q, Sun H, Zheng R, Zang C, Zhu M, Wu J, Shi X, Taing L, Liu T, Brown M, Meyer CA, Liu XS. Cistrome data browser: a data portal for ChIP-Seq and chromatin accessibility data in human and mouse. Nucleic Acids Res, 2017 Jan 4;45(D1):D658-D662. Doi: 10.1093/nar/gkw983
Cistrome Data Browser
Cistrome DB, also known as Cistrome Data Browser, is an interactive database that enables visualization of public ChIP-seq, DNase-seq, and ATAC-seq data. Backed by the huge collection of Cistrome DB, the Toolkit allows users to quickly examine their hypothesis regarding gene regulation through public ChIP-seq (protein factors and histone marks), chromatin accessibility (DNase-seq and ATAC-seq) data. Three functions have been implemented in Cistrome DB Toolkit website.
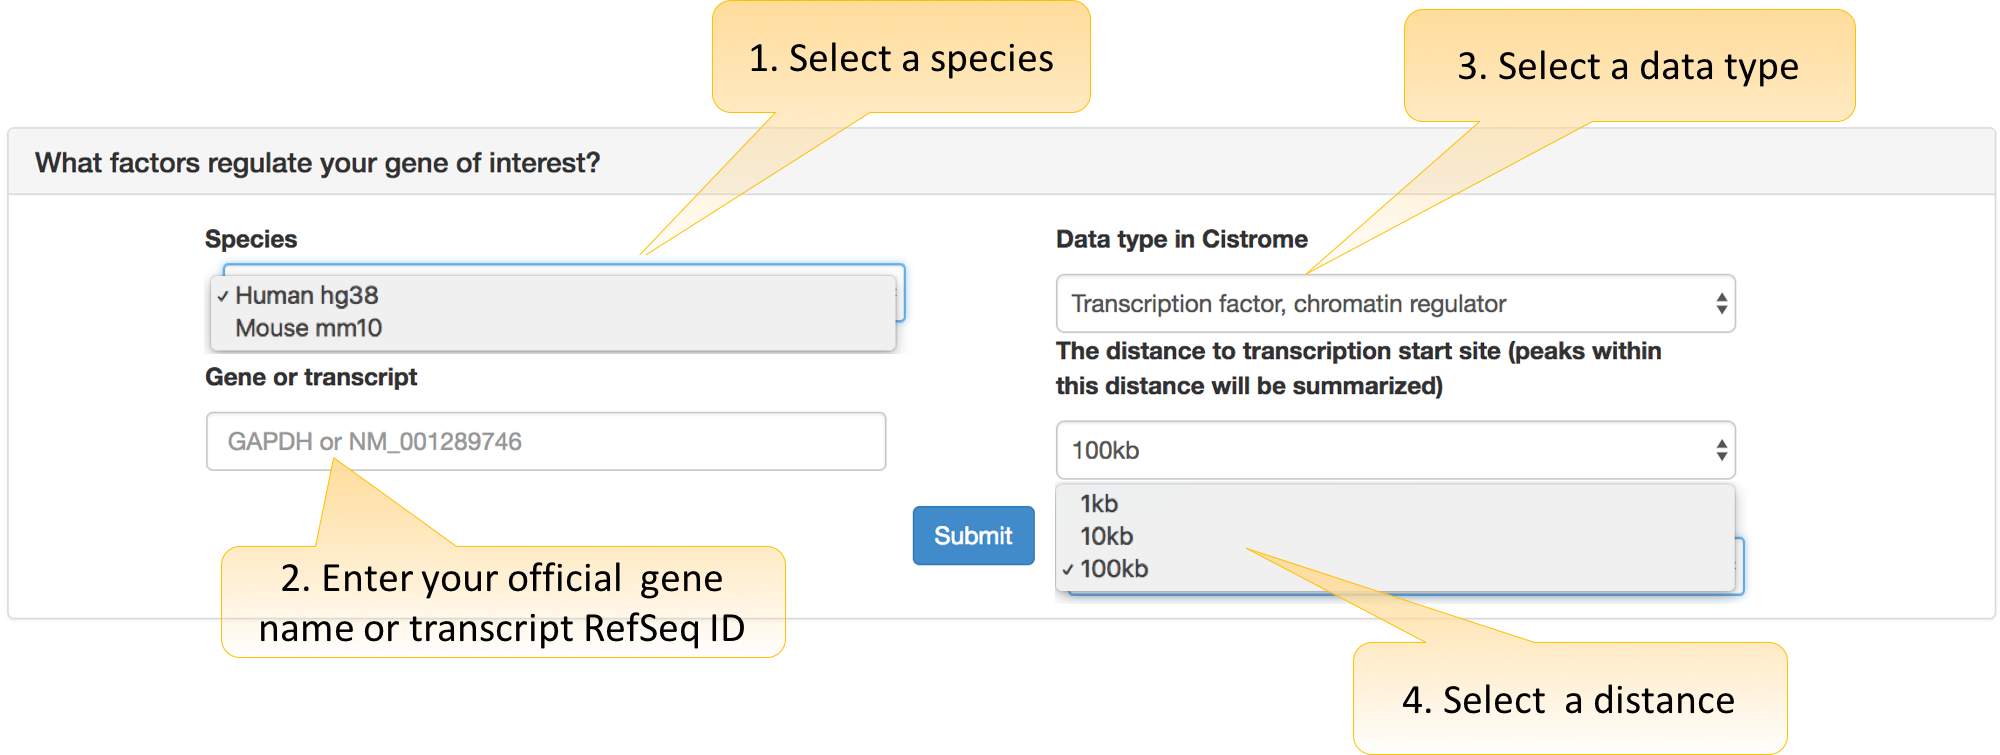
What factors regulate your gene of interest?
Gene search function allows researchers to probe which factors might regulate the user-defined genes, and what histone marks or variants might influence the user-defined gene.
How this function works?
Regulatory potential (RP) scores derived with the BETA algorithm (Su Wang et al., 2013) are used to estimate how likely a factor regulates genes. For a ChIP-seq, DNase-seq, or ATAC-seq sample, BETA uses a distance-weighted measure to gauge the regulatory potential of all the binding sites of the factor within a certain distance to a target gene. Factors with high RP scores are likely to regulate the given genes.
How to use this function in Cistrome DB Toolkit?
Three parameters are required:
Species: hg38 for human and mm10 for mouse.
Gene or transcript: official gene symbol or transcript name of RefSeq ID.
Data type in Cistrome: Cistrome bulk data are categorized as “Transcription factor, chromatin regulator,” “Histone mark and variants, chromatin accessibility” types.
Distance: 100 kb is recommended to include peaks in distal enhancers.
How to understand and visualize output ?
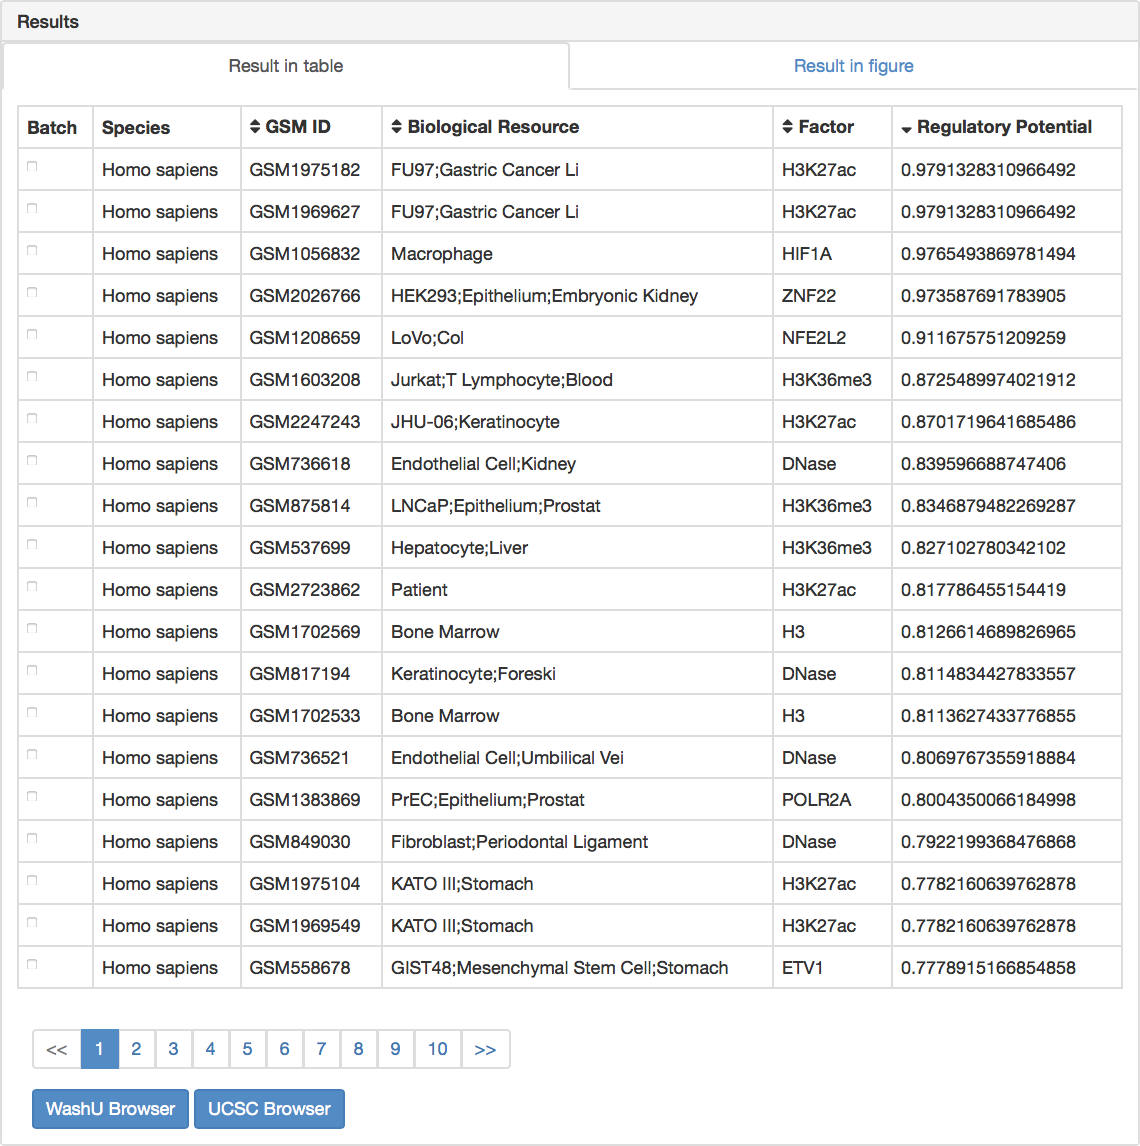
1. Results shown in a table.
User can sort the result table by clicking the column header in ascending or descending order (default: descending). Batch view of samples in genome browser is supported by marking a check in the first column, followed by clicking “WashU Browser” or “UCSC Browser.” In addition, users can check the quality control metrics, motif results, and putative targets of one specific sample by clicking in each row.
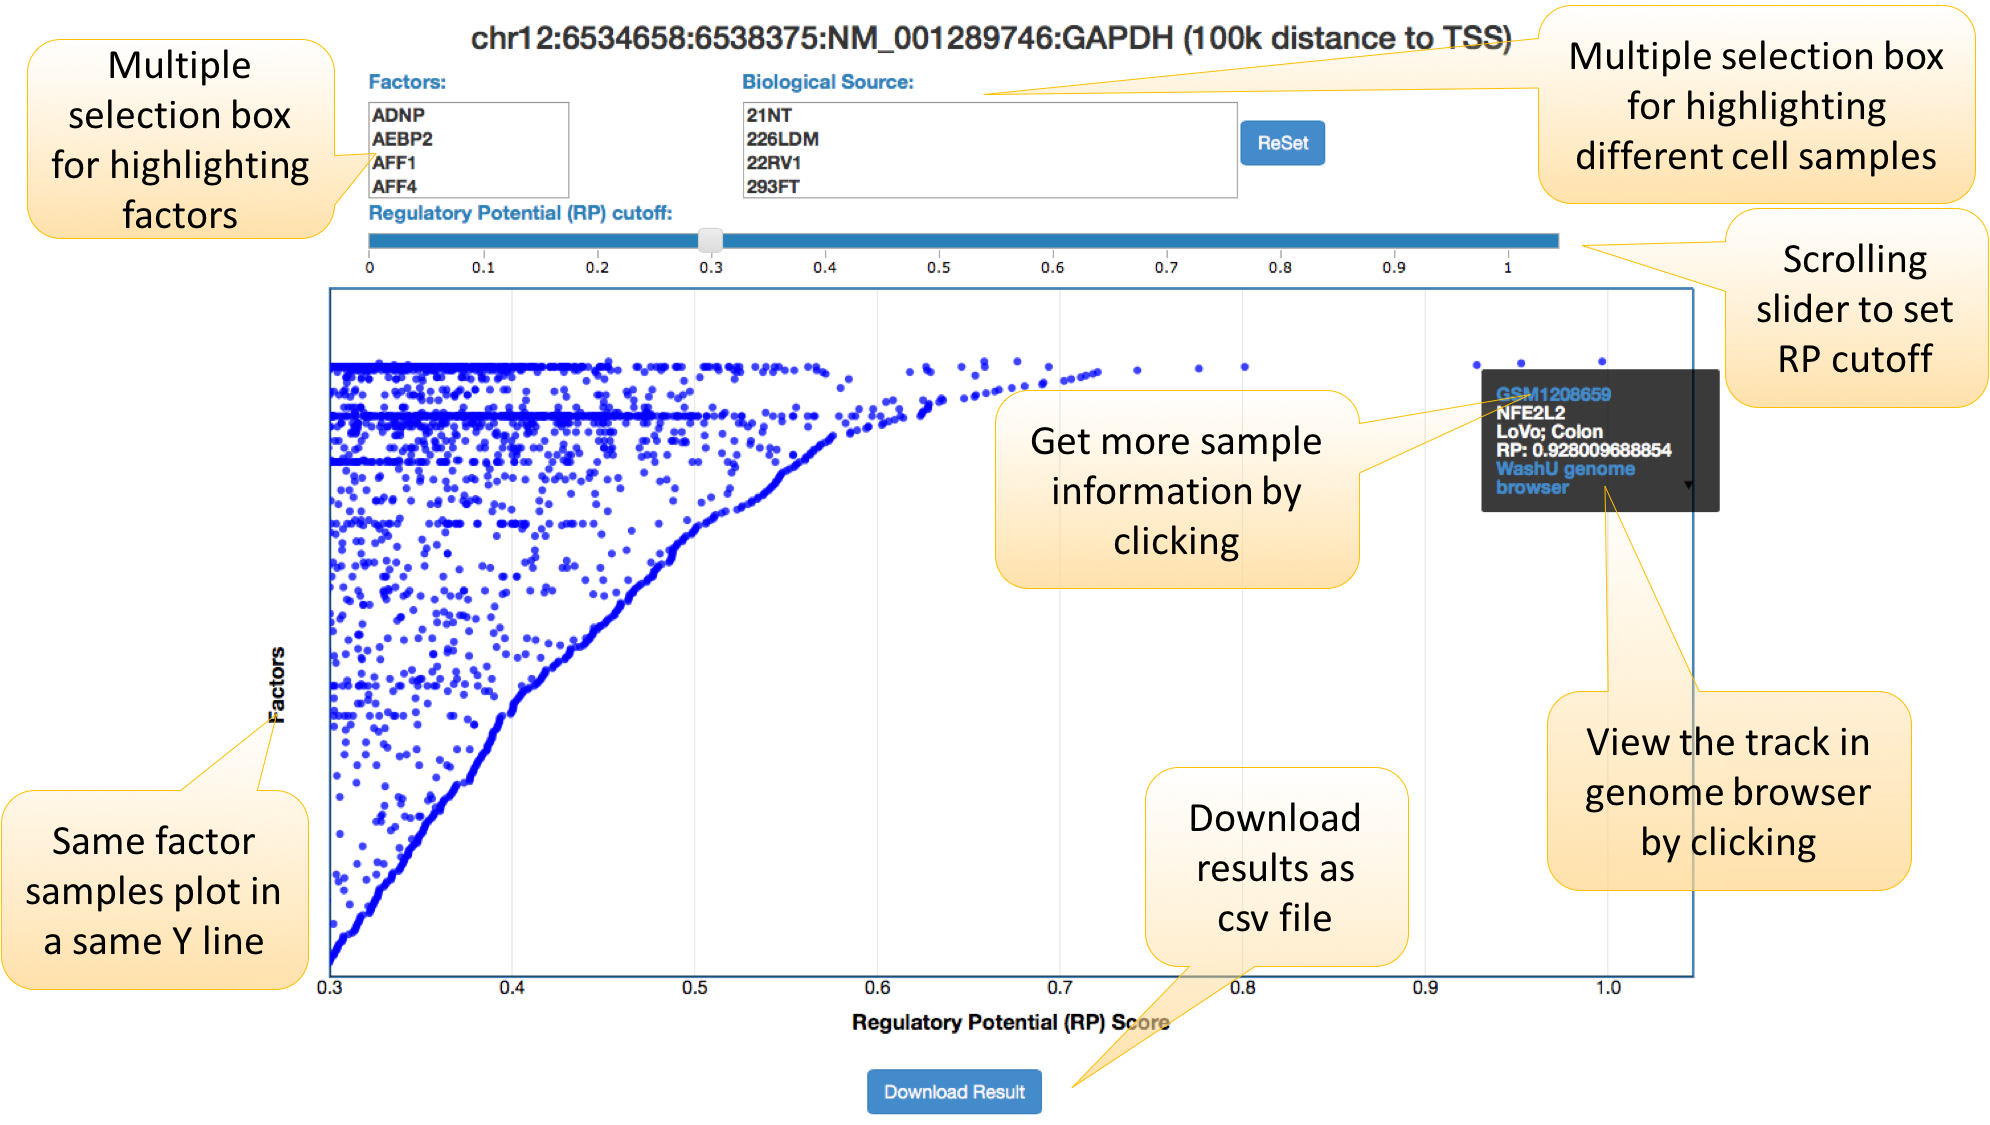
2. Results shown in a dynamic figure.
In the dynamic plot with RP scores in the X-axis and factors in the Y-axis, factors are ordered using the maximum RP score. Each dot represents a ChIP-seq / DNase-seq / ATAC-seq sample. Users can select factor, biology resource, and RP score to highlight or filter samples. The dots in the upper right corner are candidate regulators of user-defined gene.
The static plot with RP scores in the Y-axis and top 20 factors in the X-axis is available in the result page, each dot in the plot is a Cistrome DB sample. This plot is downloadable.
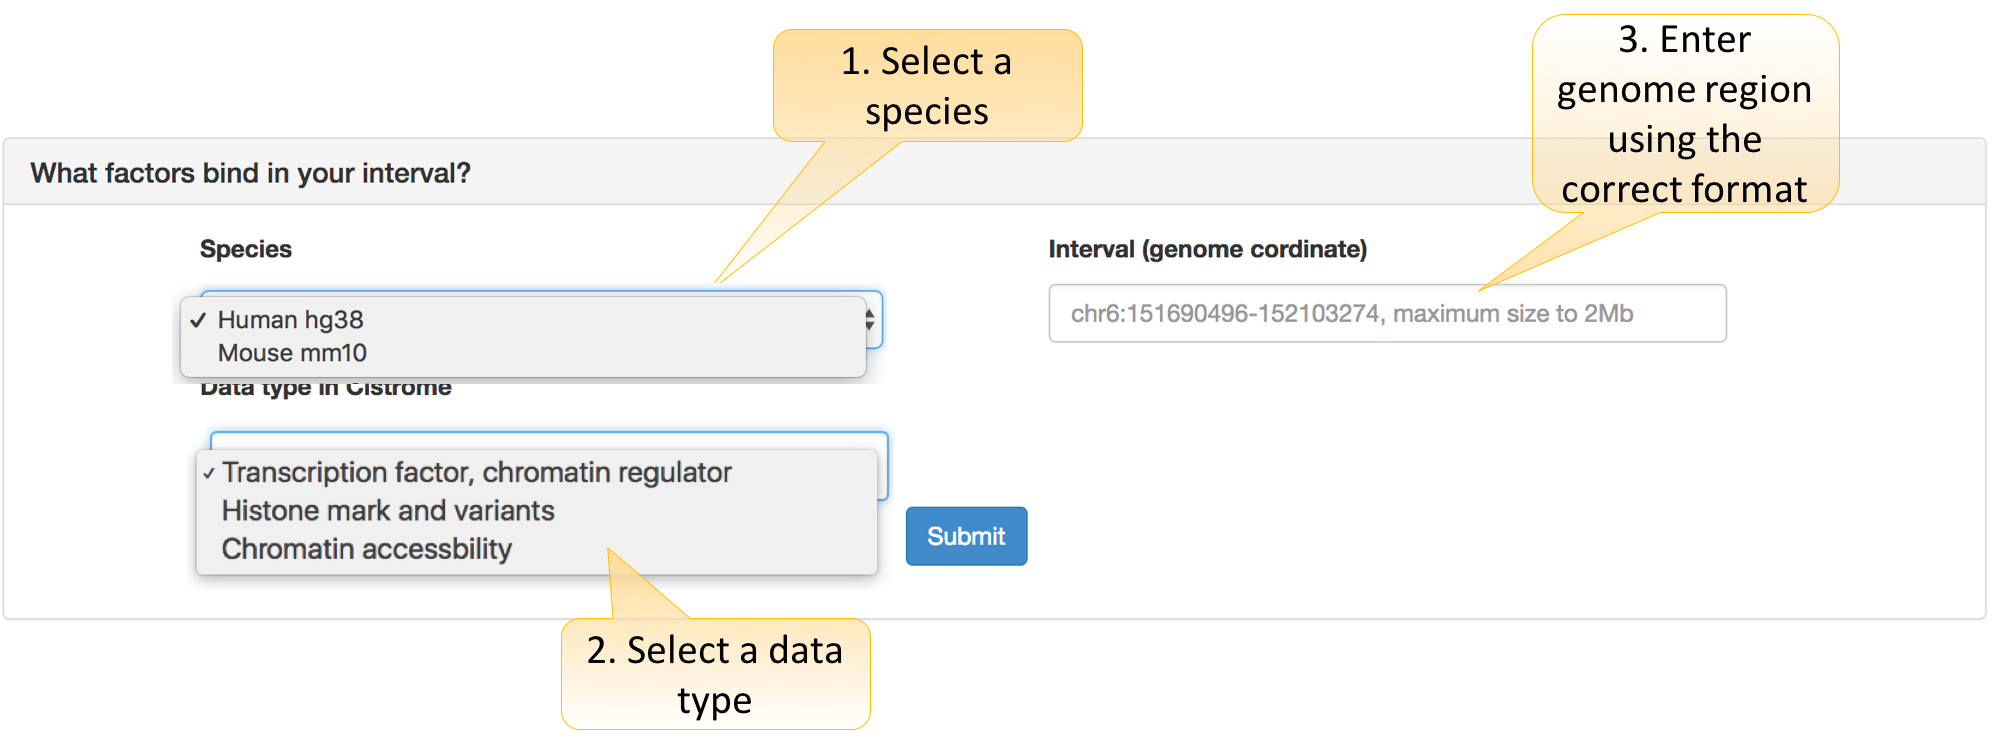
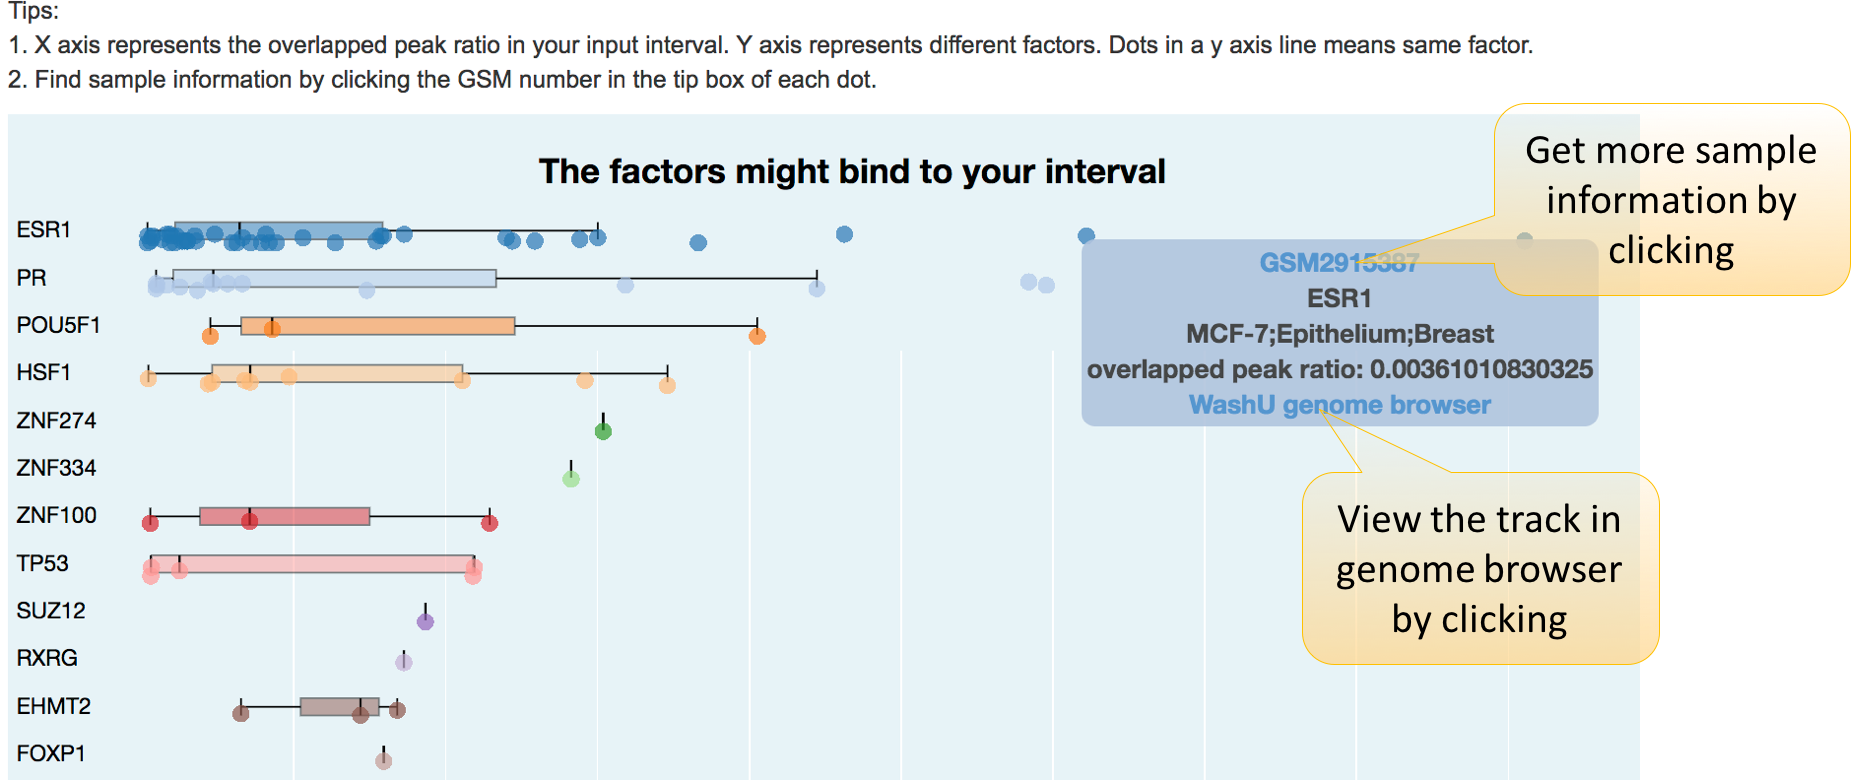
What factors bind in your interval?
With user-defined genomic regions, interval search function allows users to probe the bound factors and the chromatin status. GIGGLE software (Ryan M Layer et al., 2018) is used to search Cistrome database and return samples which contains peak sites on the interval.
How to use this function in Cistrome DB Toolkit?
Users need to decide three parameters:
Species: hg38 for the human and mm10 for the mouse.
Data type in Cistrome: Cistrome bulk data are categorized as “Transcription factor or Chromatin regulator,” “Histone mark and variants,” and “Chromatin accessibility” types.
Interval: the coordinate format (e.g., chr6:151690496-1521032174 or chr6:151690496:1521032174). We also support the input a SNP reference ID (e.g., rs1022805358).
This table is similar to the table result of gene layer function. However, this table contains the overlapped peak number, total peak number of each sample, and the overlapped peak ratio, defined as overlapped peak number divided by total peak number.
2. Results shown in a figure.
In this plot, we use overlap peak number of Cistrome DB bulk samples with the input interval to draw a boxplot for each factor. Each dot here denote a ChIP-seq / DNase-seq / ATAC-seq sample.
The static plot with RP scores in the Y-axis and top 20 factors in the X-axis is available in the result page, each dot in the plot is a Cistrome DB sample. This plot is downloadable.
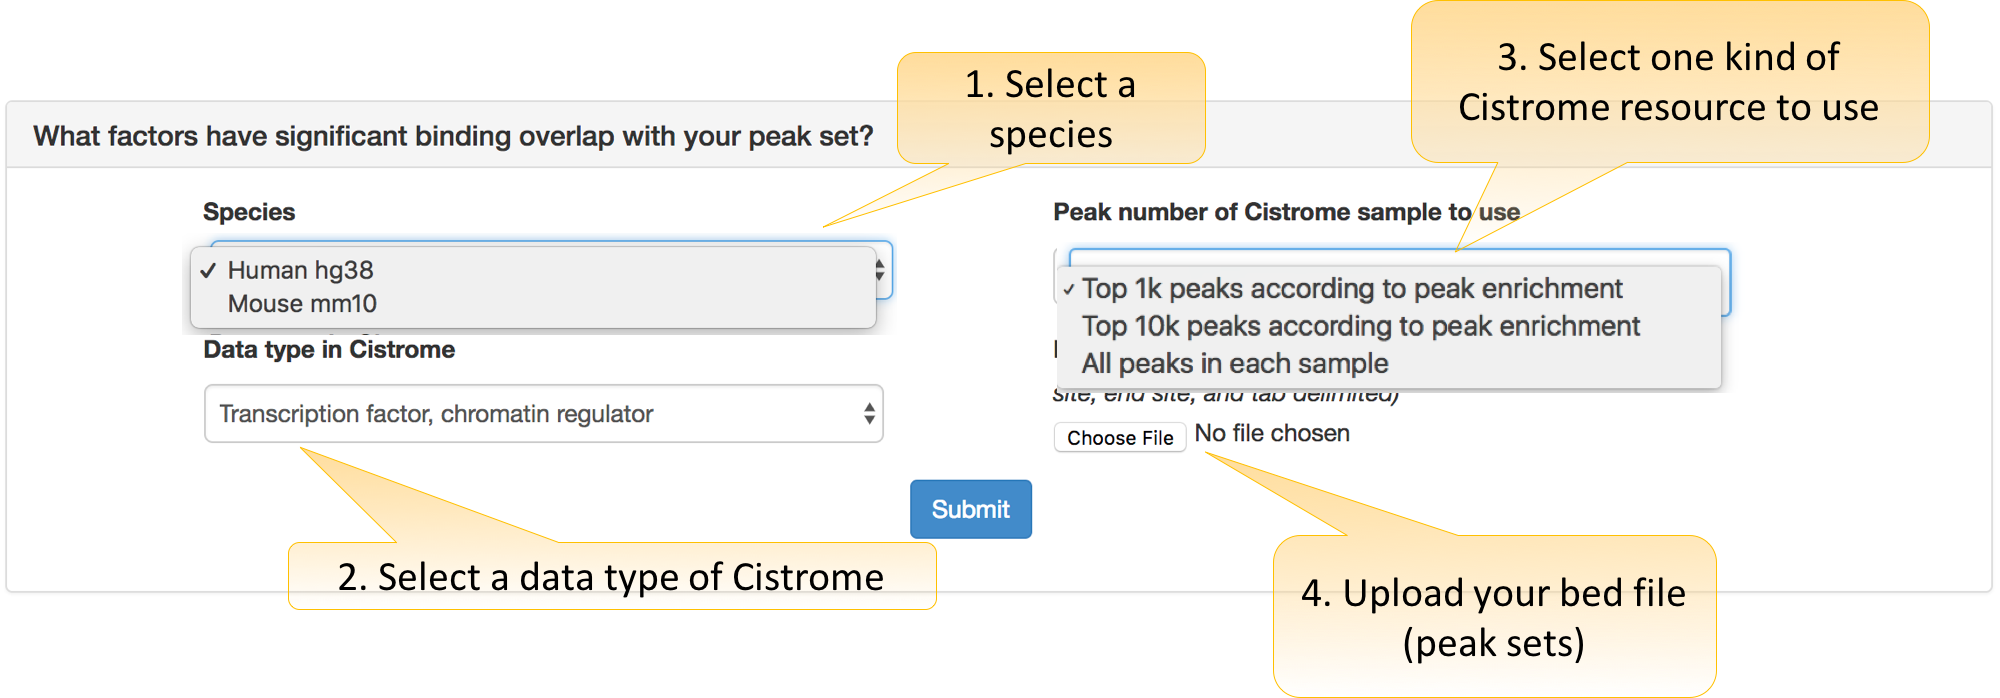
What factors have a significant binding overlap with your peak set?
A function of gene set layer aims to find relevant ChIP-seq, DNase-seq, and ATAC-seq samples. Specifically, GIGGLE software is used to search Cistrome DB samples that are similar to user-defined peak sets.
How to use this function in Cistrome DB Toolkit?
Five parameters are required to set before uploading files:
Species: hg38 for the human and mm10 for the mouse.
Data type in Cistrome: Cistrome bulk data are categorized as “Transcription factor or Chromatin regulator”, “Histone mark and variants”, and “Chromatin accessibility” types.
BED file: The uploaded file should be a BED format file, including three tab-separated values: chromosome (e.g., chr3, chrY), starting position, and ending position. Redundant columns will be ignored. MACS is recommended for ChIP-seq peak calling as its output BED file can be used directly.
Sample number to return: Number of samples similar with user-defined peak sets. The maximum number is 200.
Peak number: Considering the huge variation of peak numbers in ChIP-seq samples, users are encouraged to choose top-ranked peaks to compare with user-defined peak sets. “Top 1k peaks according to peak enrichment” is recommended since searching with top 1k peaks is more time-efficient and usually sufficient to capture sample-specific information.
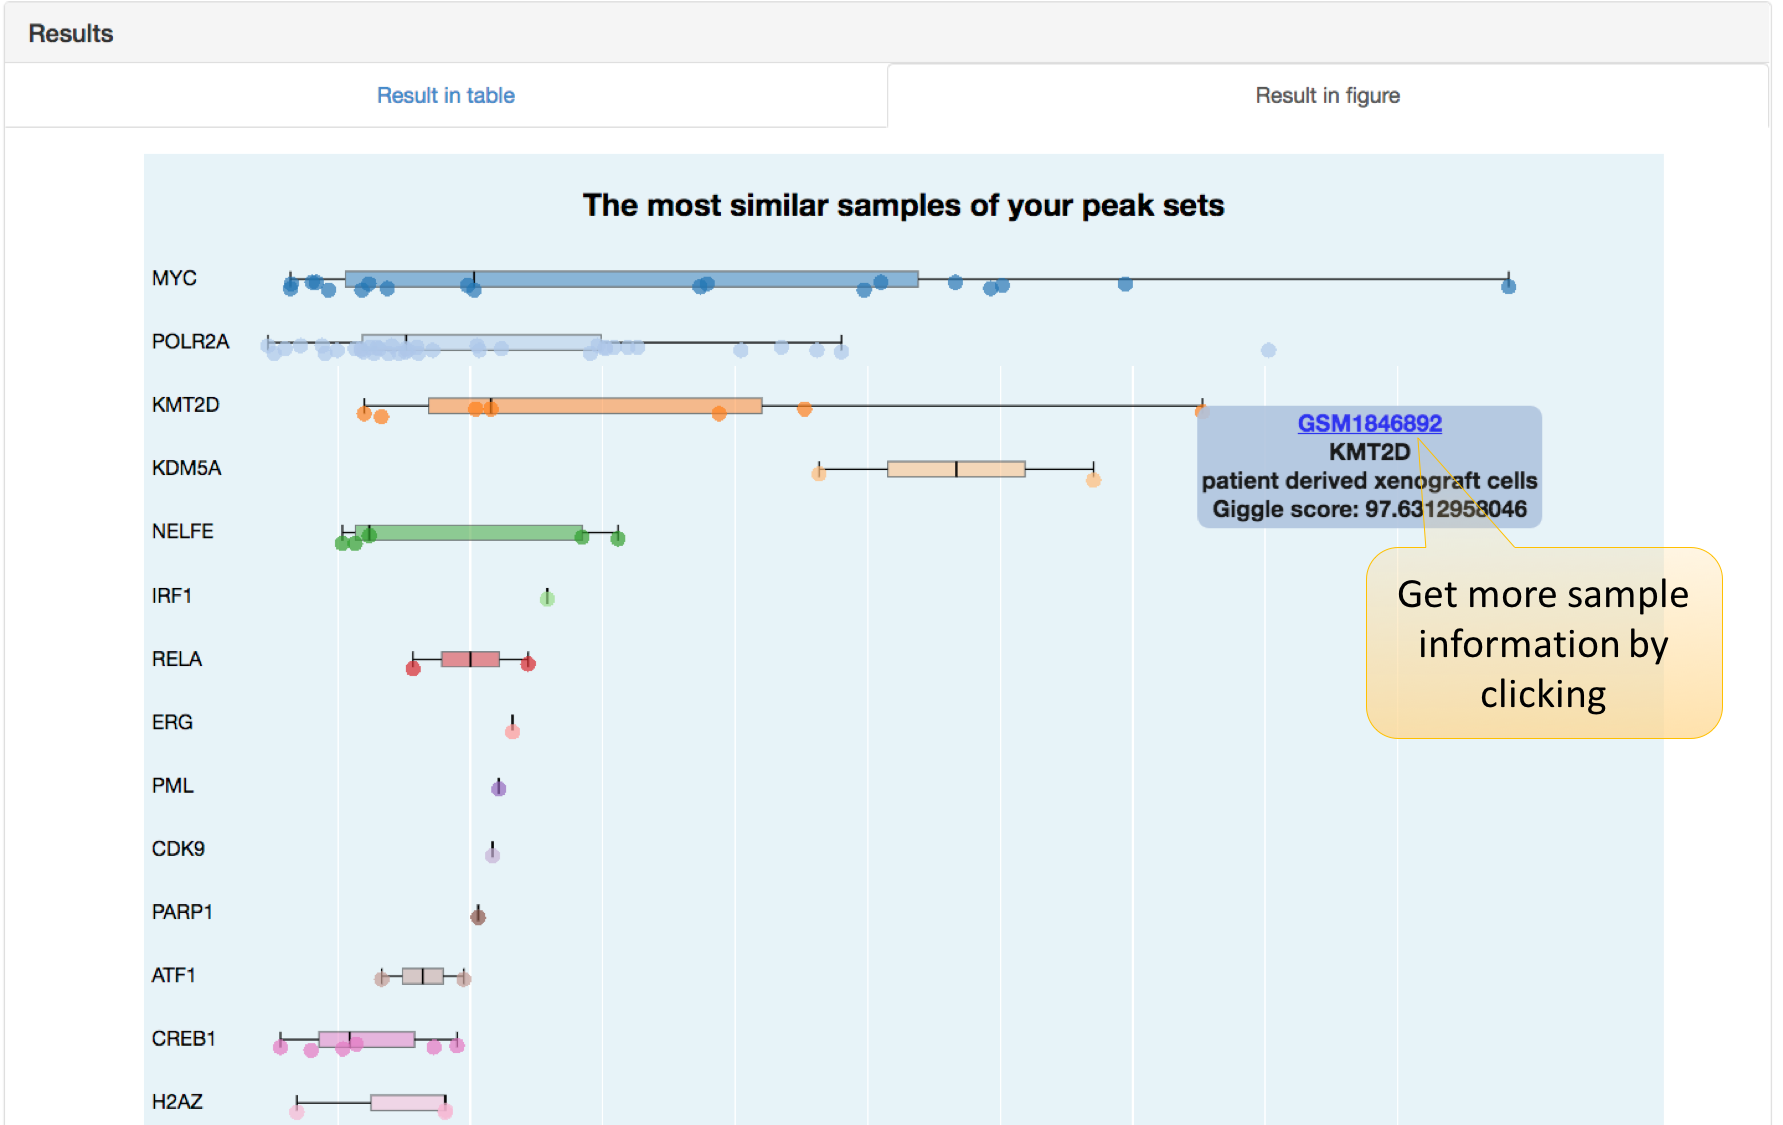
In this table, we rank result samples in descending order using GIGGLE scores, representing the similarity between a sample and user-defined peak sets.
2. Results shown in a figure.
In this plot, we use GIGGLE score of Cistrome DB bulk samples with the input interval to draw a boxplot for each factor. Each dot here represents a ChIP-seq / DNase-seq / ATAC-seq sample.
The static plot with RP scores in the Y-axis and top 20 factors in the X-axis is available in the result page, each dot in the plot is a Cistrome DB sample. This plot is downloadable.